Fuel Consumption

Author

Edison Vargas

Published

January 16, 2025

import pandas as pd
import matplotlib.pyplot as plt
import seaborn as sns

df = pd.read_csv("data/data/qld_fuel.csv")
print(df)
        Unnamed: 0    SiteId                   Site_Name   Site_Brand  \
0                1  61290151               Liberty Surat      Liberty   
1                2  61290151               Liberty Surat      Liberty   
2                3  61290151               Liberty Surat      Liberty   
3                4  61291313          Lowes Mungindi Opt           BP   
4                5  61291313          Lowes Mungindi Opt           BP   
...            ...       ...                         ...          ...   
615972      615973  61478211  Metro Petroleum Walkerston   Metro Fuel   
615973      615974  61478211  Metro Petroleum Walkerston   Metro Fuel   
615974      615975  61478212      Pitt Stop Classic Café  Independent   
615975      615976  61478212      Pitt Stop Classic Café  Independent   
615976      615977  61478212      Pitt Stop Classic Café  Independent   

       Sites_Address_Line_1 Site_Suburb Site_State  Site_Post_Code  \
0        61 Burrowes Street       Surat        QLD            4417   
1        61 Burrowes Street       Surat        QLD            4417   
2        61 Burrowes Street       Surat        QLD            4417   
3         126 Barwon Street    Mungindi        QLD            4497   
4         126 Barwon Street    Mungindi        QLD            4497   
...                     ...         ...        ...             ...   
615972          2 Dutton St  Walkerston        QLD            4751   
615973          2 Dutton St  Walkerston        QLD            4751   
615974          34 Palm Ave    Seaforth        QLD            4741   
615975          34 Palm Ave    Seaforth        QLD            4741   
615976          34 Palm Ave    Seaforth        QLD            4741   

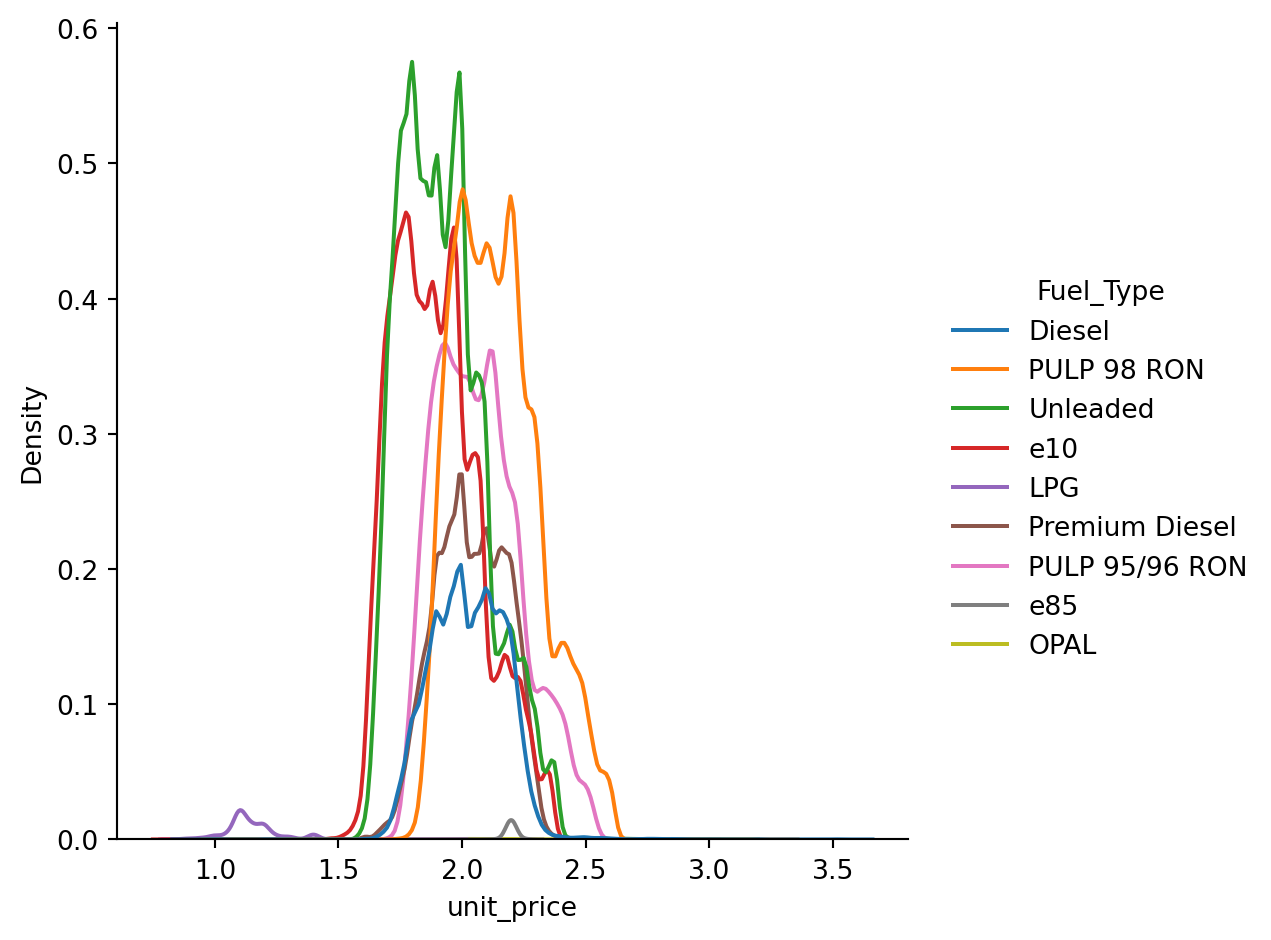
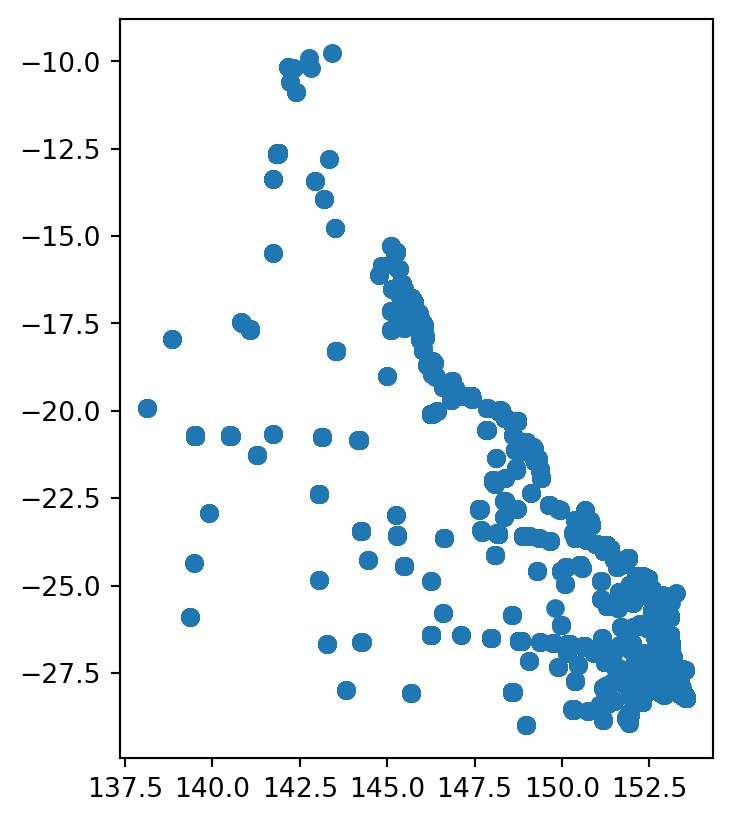
        Site_Latitude  Site_Longitude    Fuel_Type  Price  \
0          -27.151687      149.067742       Diesel   1999   
1          -27.151687      149.067742  PULP 98 RON   2159   
2          -27.151687      149.067742     Unleaded   1959   
3          -28.973467      148.983829       Diesel   1990   
4          -28.973467      148.983829     Unleaded   1920   
...               ...             ...          ...    ...   
615972     -21.160166      149.063728     Unleaded   1959   
615973     -21.160166      149.063728     Unleaded   1989   
615974     -20.899741      148.964986     Unleaded   2049   
615975     -20.899741      148.964986     Unleaded   2039   
615976     -20.899741      148.964986     Unleaded   2099   

         TransactionDateutc  X_id  
0       2023-10-12 21:56:00   NaN  
1       2023-12-30 06:54:00   NaN  
2       2023-12-30 06:54:00   NaN  
3       2023-06-12 22:00:00   NaN  
4       2023-06-12 22:00:00   NaN  
...                     ...   ...  
615972  2023-09-20 05:14:00   NaN  
615973  2023-09-25 08:08:00   NaN  
615974  2023-04-09 04:15:00   NaN  
615975  2023-04-09 04:24:00   NaN  
615976  2023-09-25 06:26:00   NaN  

[615977 rows x 14 columns]
# initial exploration
df.columns

df.info()

df.head()

df["Fuel_Type"]

pd.unique(df["Fuel_Type"])

df.describe()

df["Fuel_Type"].describe()

pd.unique(df["Site_Suburb"])

df["Site_Suburb"].describe()

pd.unique(df["Site_State"])

df["Site_State"].describe()


df[5 : 10]

pd.unique(df["Site_Name"])

df["Site_Name"].describe()

df.dtypes

df["Price"].describe()

df["Site_Brand"].describe()
<class 'pandas.core.frame.DataFrame'>
RangeIndex: 615977 entries, 0 to 615976
Data columns (total 14 columns):
 #   Column                Non-Null Count   Dtype  
---  ------                --------------   -----  
 0   Unnamed: 0            615977 non-null  int64  
 1   SiteId                615977 non-null  int64  
 2   Site_Name             615977 non-null  object 
 3   Site_Brand            615977 non-null  object 
 4   Sites_Address_Line_1  615977 non-null  object 
 5   Site_Suburb           615977 non-null  object 
 6   Site_State            615977 non-null  object 
 7   Site_Post_Code        615977 non-null  int64  
 8   Site_Latitude         615977 non-null  float64
 9   Site_Longitude        615977 non-null  float64
 10  Fuel_Type             615977 non-null  object 
 11  Price                 615977 non-null  int64  
 12  TransactionDateutc    615977 non-null  object 
 13  X_id                  121457 non-null  float64
dtypes: float64(3), int64(4), object(7)
memory usage: 65.8+ MB
count       615977
unique          25
top       7 Eleven
freq        118040
Name: Site_Brand, dtype: object
# summaries
gb = df.groupby("Fuel_Type")

avg_fuel_by_price = gb["Price"].agg("mean")

plt.ion()
avg_fuel_by_price.plot()
plt.show()

# Ensure reasonable heights
df = df[ (500 < df["Price"]) & (df["Price"] < 4000)]

df["unit_price"] = df["Price"] / 1000

df.to_csv("data/filtered_fuel.csv")

sns.catplot(data = df, x = "Fuel_Type", y = "Price")
plt.show()


sns.catplot(data = df, x = "Site_State", y = "Fuel_Type")
plt.show()


# Remove unleaded Fuel_type
df1 = df[df["Fuel_Type"] != "Unleaded"]

# sns.catplot(data = df1, x = "Site_State", y = "Fuel_Type")
plt.show()

# Remove unknown Site_Brand
df2 = df[df["Site_Brand"] != "Unknown"]

# sns.catplot(data = df2, x = "Site_State", y = "Site_Brand", kind = "bar")
plt.show()


sns.displot(data = df, x = "Price", hue = "Fuel_Type", kind = "kde")
plt.show()

sns.displot(data = df, x = "unit_price", hue = "Fuel_Type", kind = "kde")
plt.show()

# sns.catplot(data=df, x="unit_price", y="Fuel_type")
plt.show()

/tmp/ipykernel_13074/1557198801.py:13: SettingWithCopyWarning:


A value is trying to be set on a copy of a slice from a DataFrame.
Try using .loc[row_indexer,col_indexer] = value instead

See the caveats in the documentation: https://pandas.pydata.org/pandas-docs/stable/user_guide/indexing.html#returning-a-view-versus-a-copy

import pandas as pd
fuel = pd.read_csv("data/data/qld_fuel.csv")
import geopandas 
fuel_geo = geopandas.GeoDataFrame(fuel, geometry = geopandas.points_from_xy(x = fuel.Site_Longitude, y = fuel.Site_Latitude)) 
fuel_geo.plot()

import plotly.express as px
figure = px.scatter(data_frame = df, x = "Fuel_Type", y = "unit_price", color = "Site_State",
           facet_col = "Site_State", hover_name = "Site_Brand",
           hover_data = "Site_Suburb")

figure.write_html("fuel.html")
import pandas as pd
fuel = pd.read_csv("data/data/qld_fuel.csv")
import geopandas 
fuel_geo = geopandas.GeoDataFrame(fuel, geometry = geopandas.points_from_xy(x = fuel.Site_Longitude, y = fuel.Site_Latitude)) 
fuel_geo.plot()