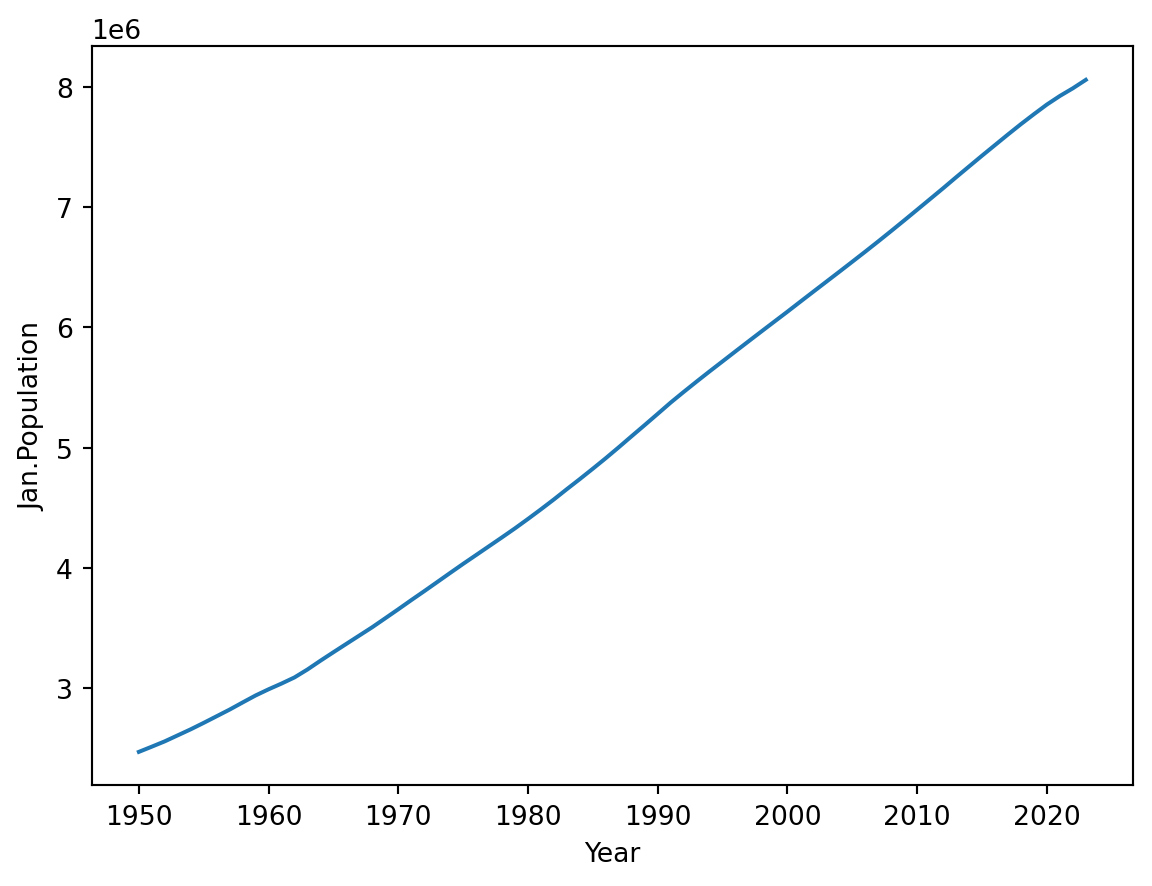
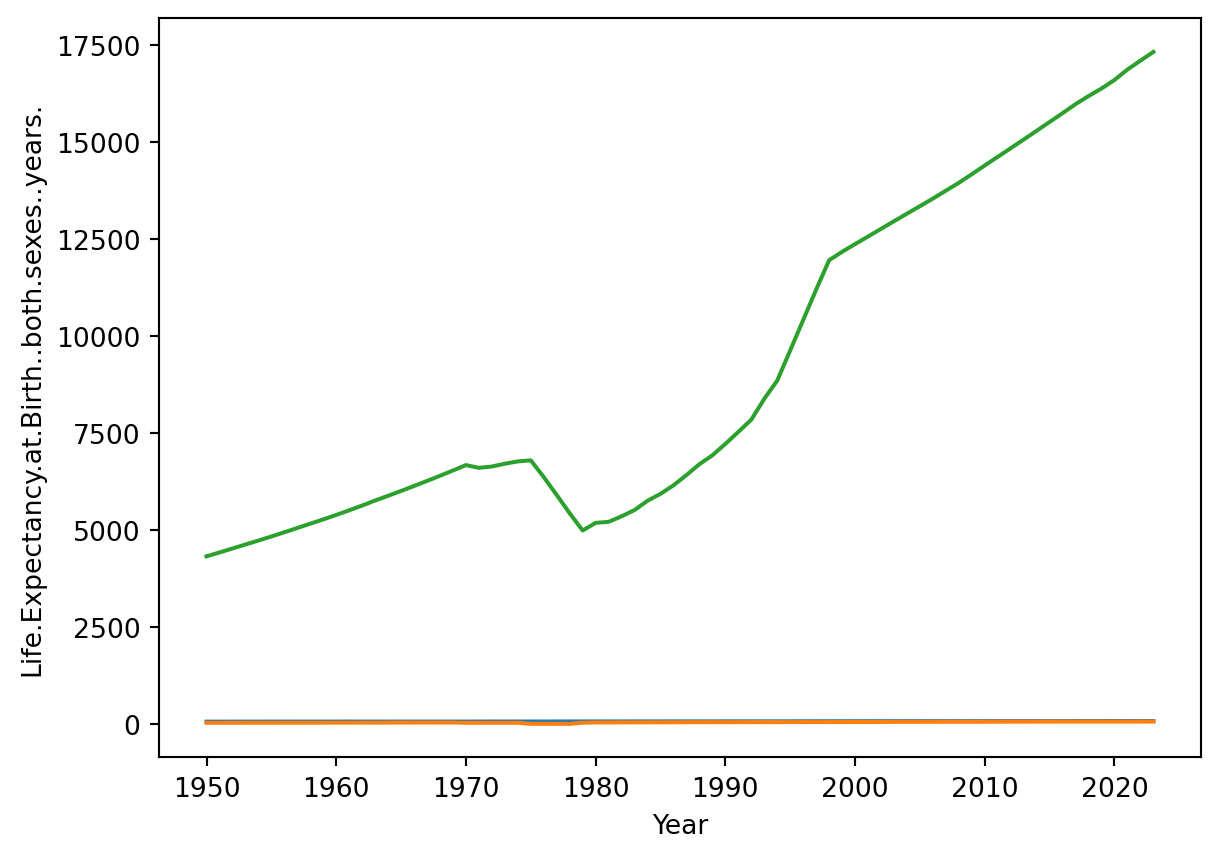
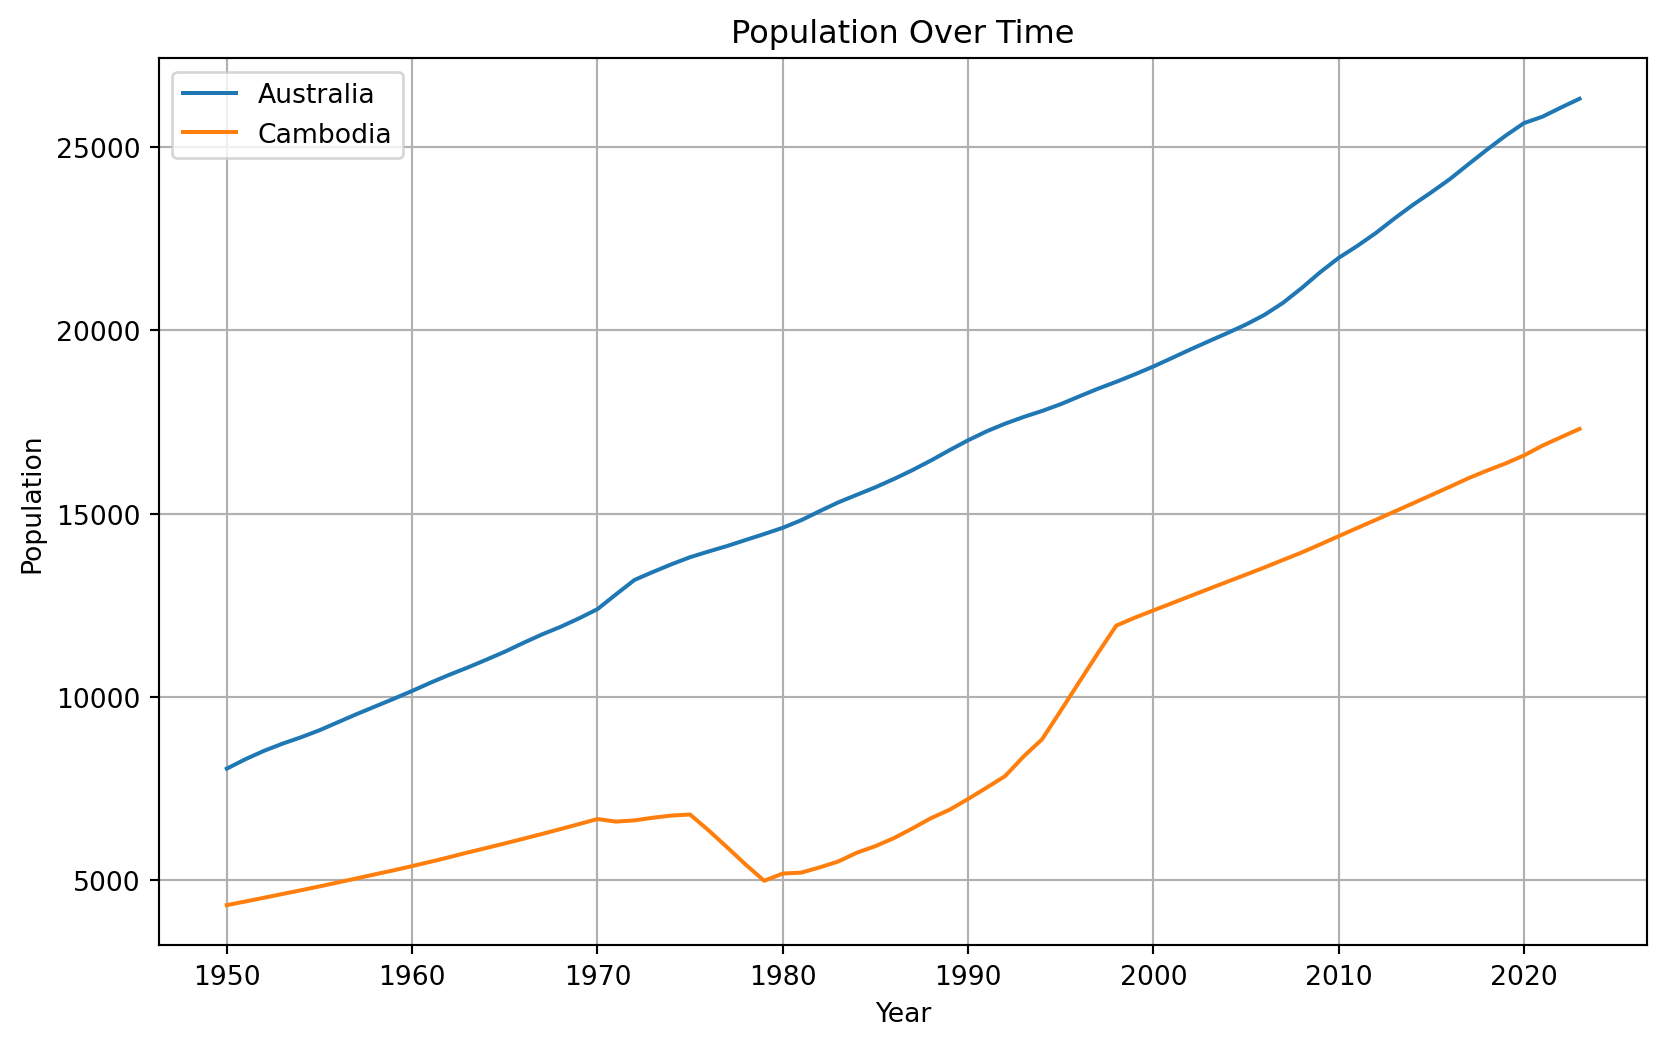
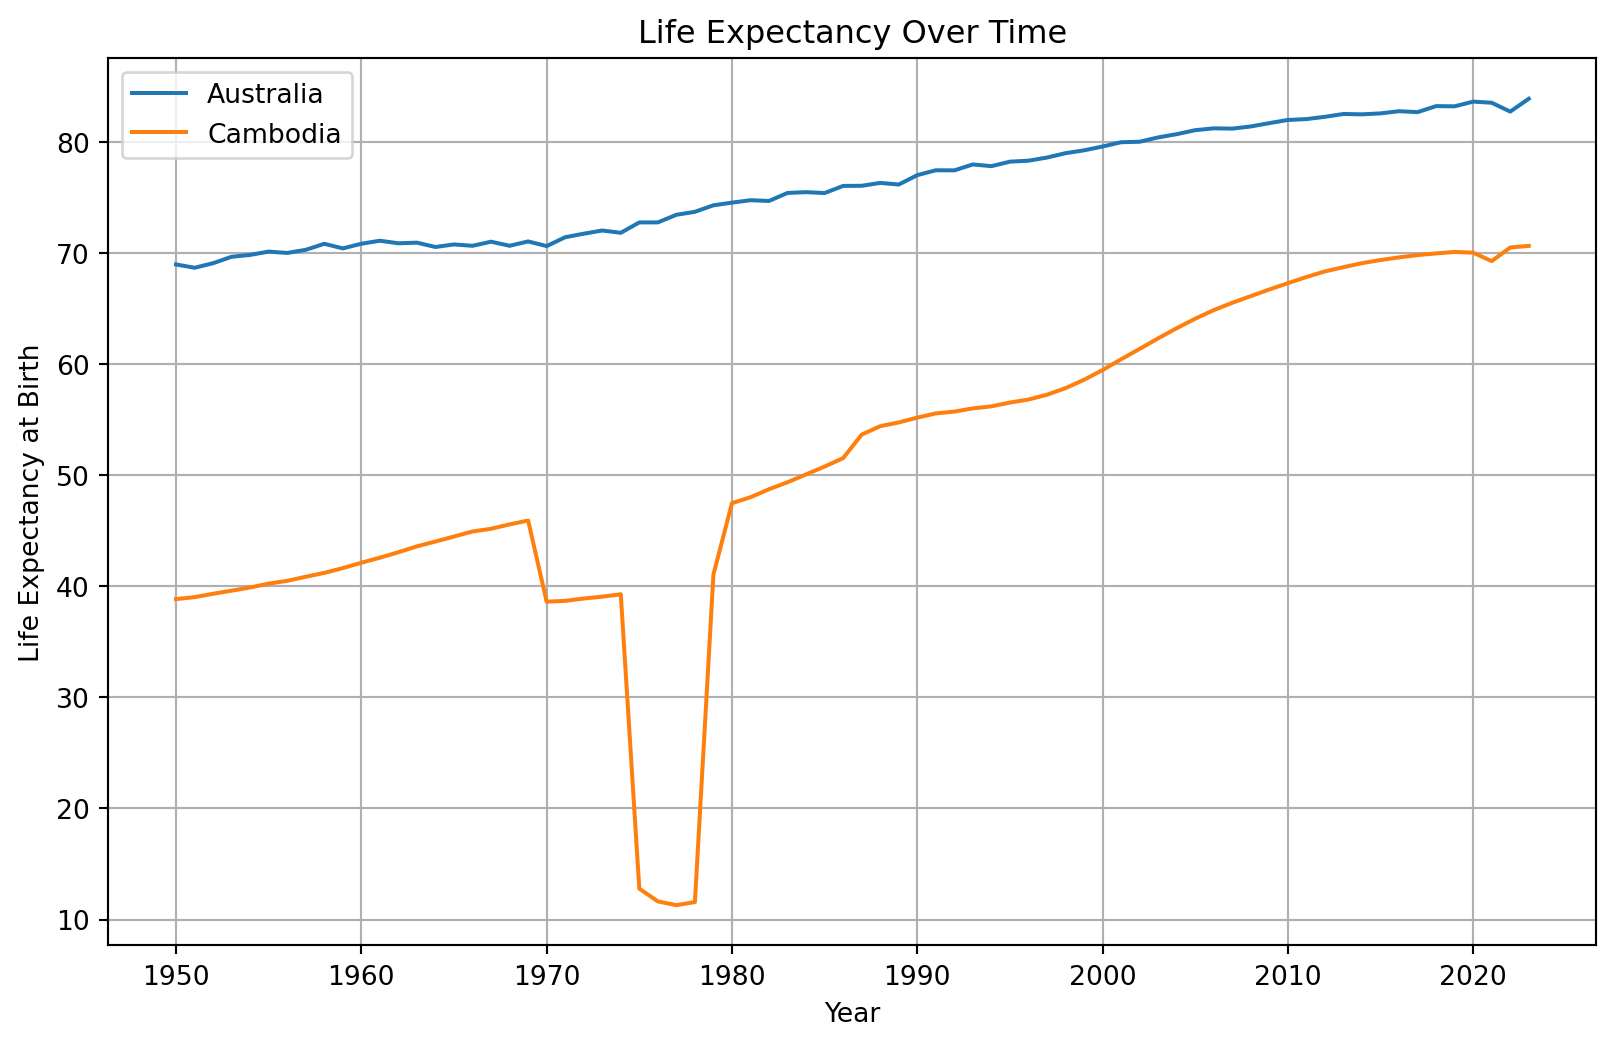
We wanted to look at life expectancy and population over tie between Australia and Cambodia to compare differences bettwen diferent regions We used the popultion csvand extracted data from Janyary population column and also identified australia and Cambodia We generated graphs using seaborn and can see the effect of the war in Cambodiaduring the late 70s
Show code
# Set up codeimport pandas as pdimport pandas as pdimport matplotlib.pyplot as pltimport seaborn as snsdf_raw = pd.read_csv("../../data_sources/population.csv")df = df_raw.copy()plt.show()df_raw.shapedf_raw.columnsWorld=df.loc[df["Region"]=="World"]sns.lineplot(data=World, x="Year", y="Jan.Population")df_raw = pd.read_csv("../../data_sources/population.csv")plt.show()df_raw.shapedf_raw.columnsdf["Jan.Population"]Australia=df.loc[df["Region"]=="Australia"]sns.lineplot(data=Australia, x="Year", y="Life.Expectancy.at.Birth..both.sexes..years.")Cambodia=df.loc[df["Region"]=="Cambodia"]sns.lineplot(data=Cambodia, x="Year", y="Life.Expectancy.at.Birth..both.sexes..years.")sns.lineplot(data=Cambodia, x="Year", y="Jan.Population")countries = ["Australia", "Cambodia",]df_countries = df[df["Region"].isin(countries)].copy()plt.figure(figsize=(10, 6))for country in countries: subset = df_countries[df_countries["Region"] == country] plt.plot(subset["Year"], subset["Jan.Population"], label=country)plt.xlabel("Year")plt.ylabel("Population")plt.title("Population Over Time")plt.legend()plt.grid(True)plt.show()plt.figure(figsize=(10, 6))for country in countries: subset = df_countries[df_countries["Region"] == country] plt.plot(subset["Year"], subset["Life.Expectancy.at.Birth..both.sexes..years."], label=country)plt.xlabel("Year")plt.ylabel("Life Expectancy at Birth")plt.title("Life Expectancy Over Time")plt.legend()plt.grid(True)plt.show()
Source Code
---title: Life expectancy comparison between Australian and Cambodian populations between 1950 and 2023 author: Rob Cincotta and Diana Sanabriadate: July 10, 2025# The following are optional but recommendedwarning: false#######image: tb.png format: html: code-fold: true code-summary: "Show code" code-tools: true---## IntroductionWe wanted to look at life expectancy and population over tie between Australia and Cambodia to compare differences bettwen diferent regions We used the popultion csvand extracted data from Janyary population column and also identified australia and Cambodia We generated graphs using seaborn and can see the effect of the war in Cambodiaduring the late 70s ```{python}# Set up codeimport pandas as pdimport pandas as pdimport matplotlib.pyplot as pltimport seaborn as snsdf_raw = pd.read_csv("../../data_sources/population.csv")df = df_raw.copy()plt.show()df_raw.shapedf_raw.columnsWorld=df.loc[df["Region"]=="World"]sns.lineplot(data=World, x="Year", y="Jan.Population")df_raw = pd.read_csv("../../data_sources/population.csv")plt.show()df_raw.shapedf_raw.columnsdf["Jan.Population"]Australia=df.loc[df["Region"]=="Australia"]sns.lineplot(data=Australia, x="Year", y="Life.Expectancy.at.Birth..both.sexes..years.")Cambodia=df.loc[df["Region"]=="Cambodia"]sns.lineplot(data=Cambodia, x="Year", y="Life.Expectancy.at.Birth..both.sexes..years.")sns.lineplot(data=Cambodia, x="Year", y="Jan.Population")countries = ["Australia", "Cambodia",]df_countries = df[df["Region"].isin(countries)].copy()plt.figure(figsize=(10, 6))for country in countries: subset = df_countries[df_countries["Region"] == country] plt.plot(subset["Year"], subset["Jan.Population"], label=country)plt.xlabel("Year")plt.ylabel("Population")plt.title("Population Over Time")plt.legend()plt.grid(True)plt.show()plt.figure(figsize=(10, 6))for country in countries: subset = df_countries[df_countries["Region"] == country] plt.plot(subset["Year"], subset["Life.Expectancy.at.Birth..both.sexes..years."], label=country)plt.xlabel("Year")plt.ylabel("Life Expectancy at Birth")plt.title("Life Expectancy Over Time")plt.legend()plt.grid(True)plt.show()```