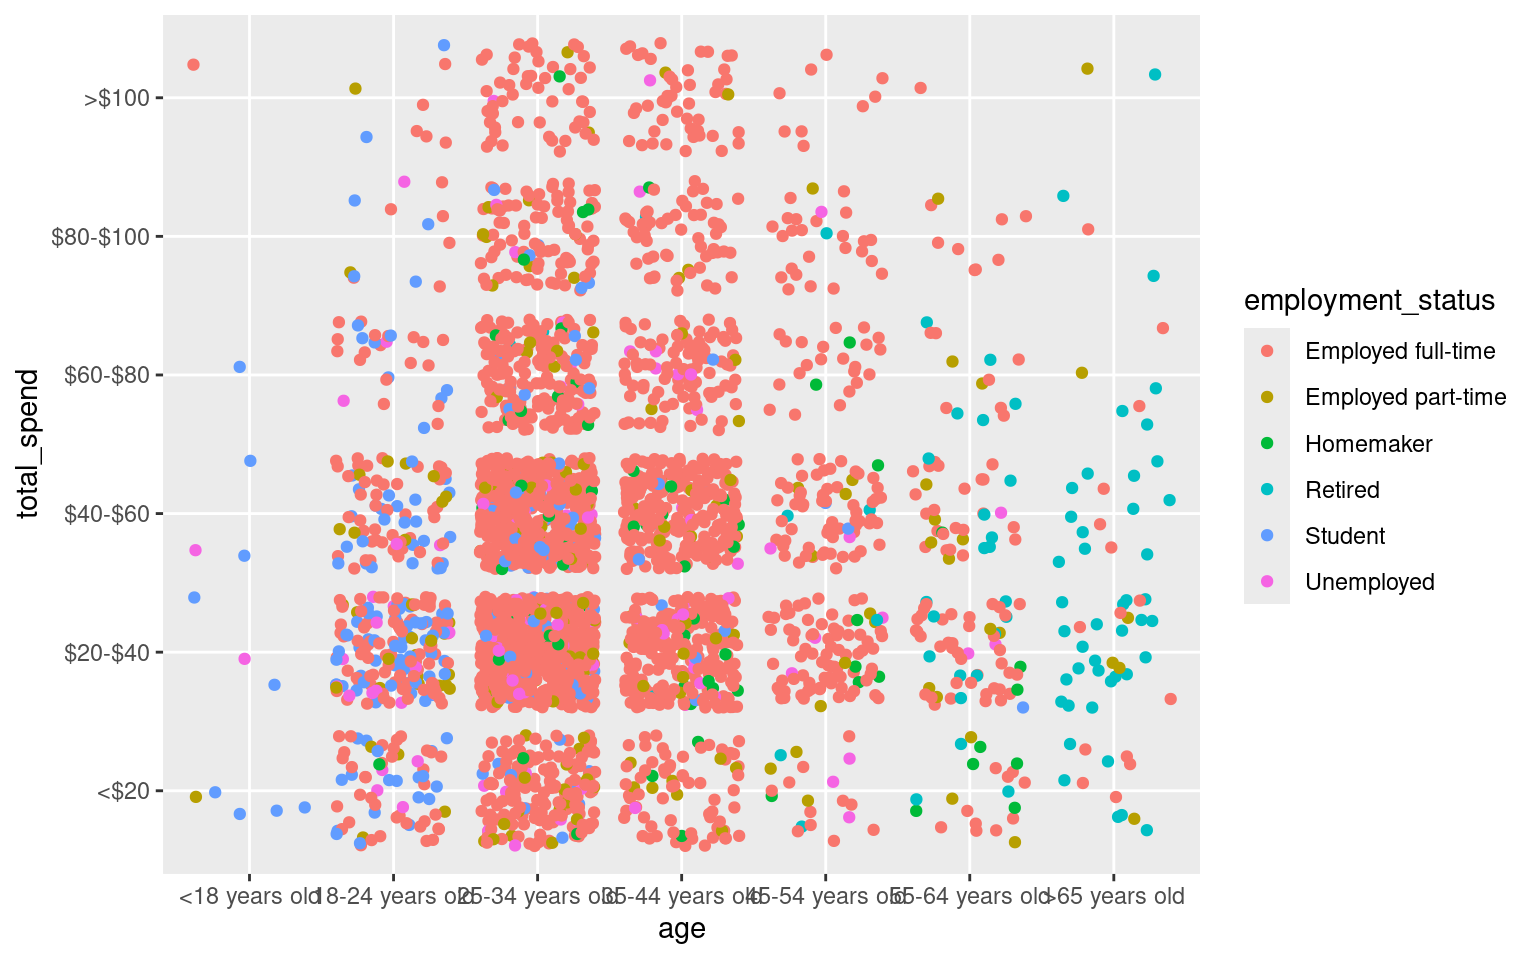
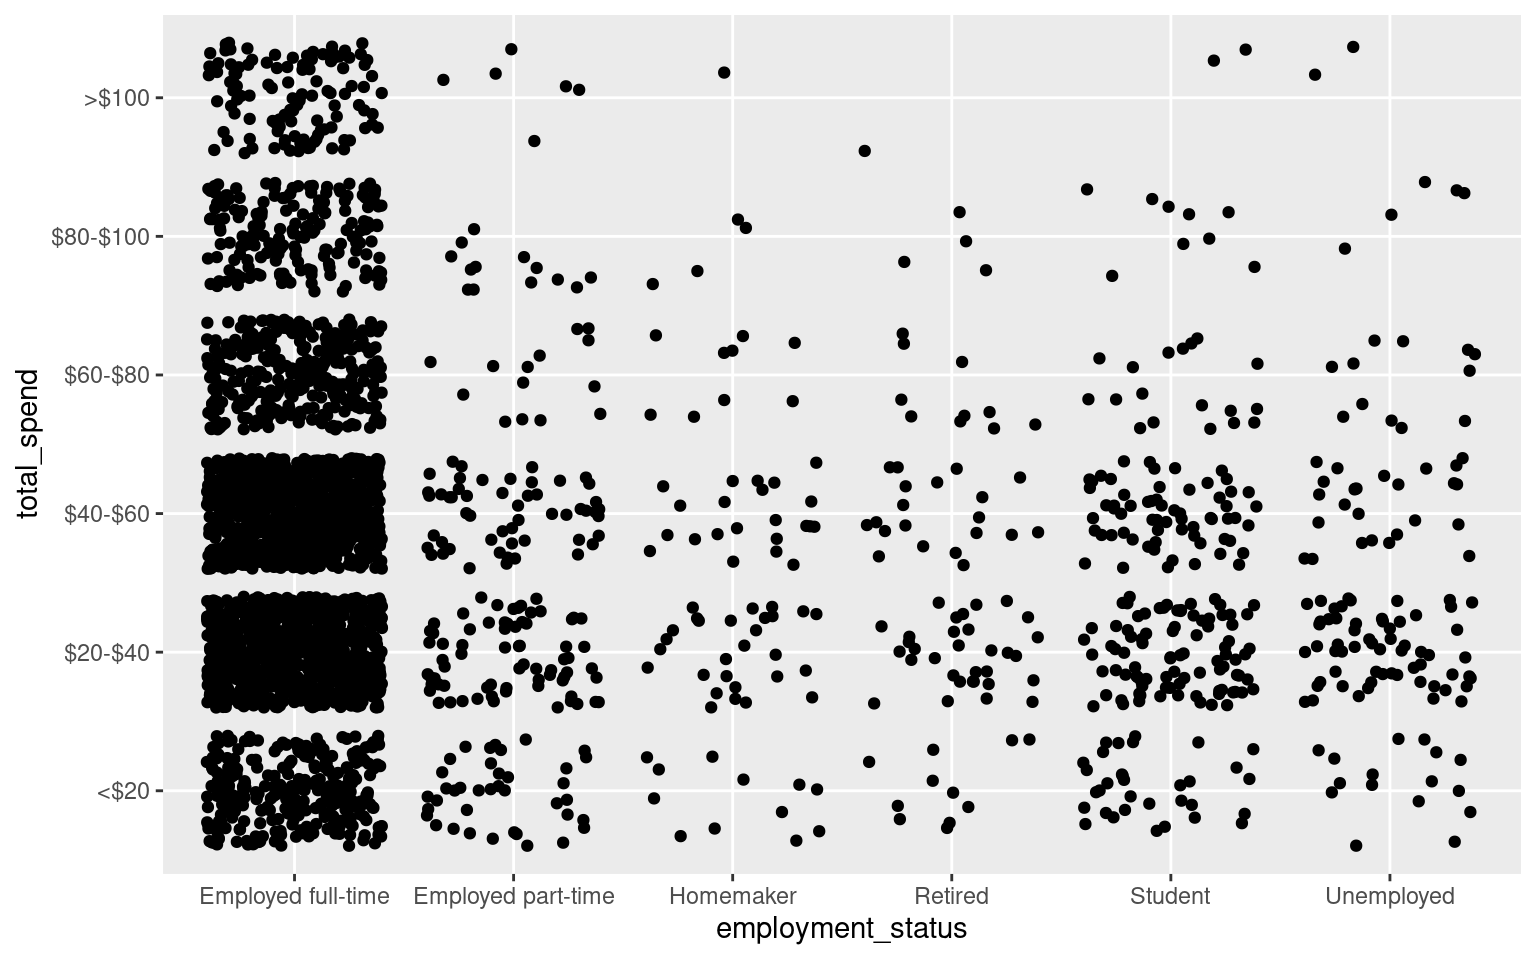
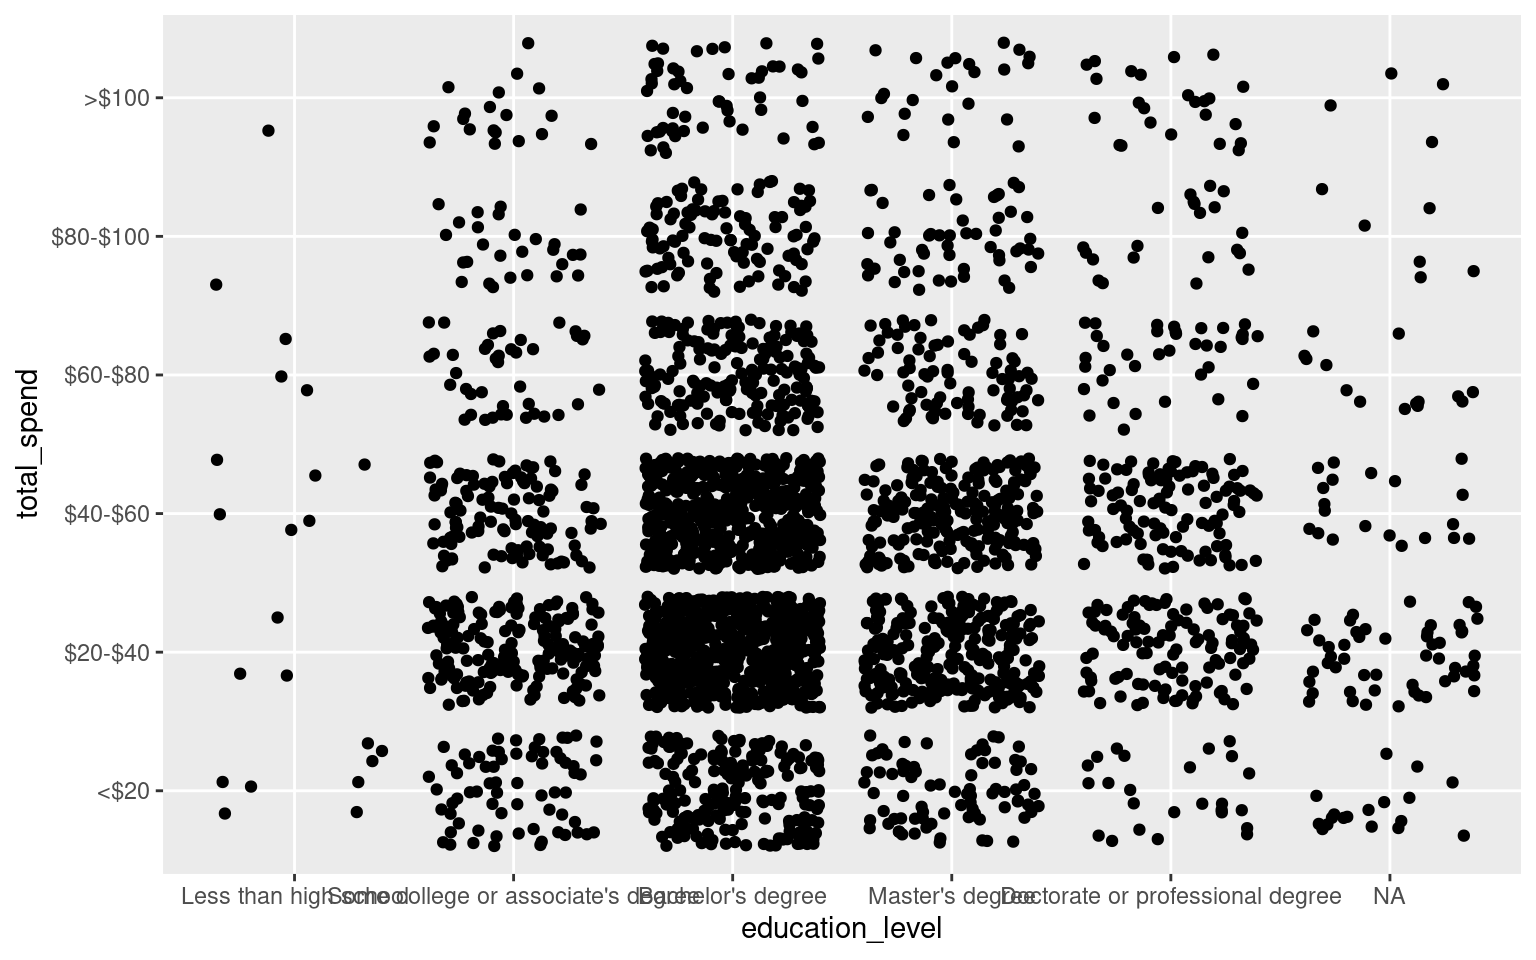
Plot age, employment and education vs spending
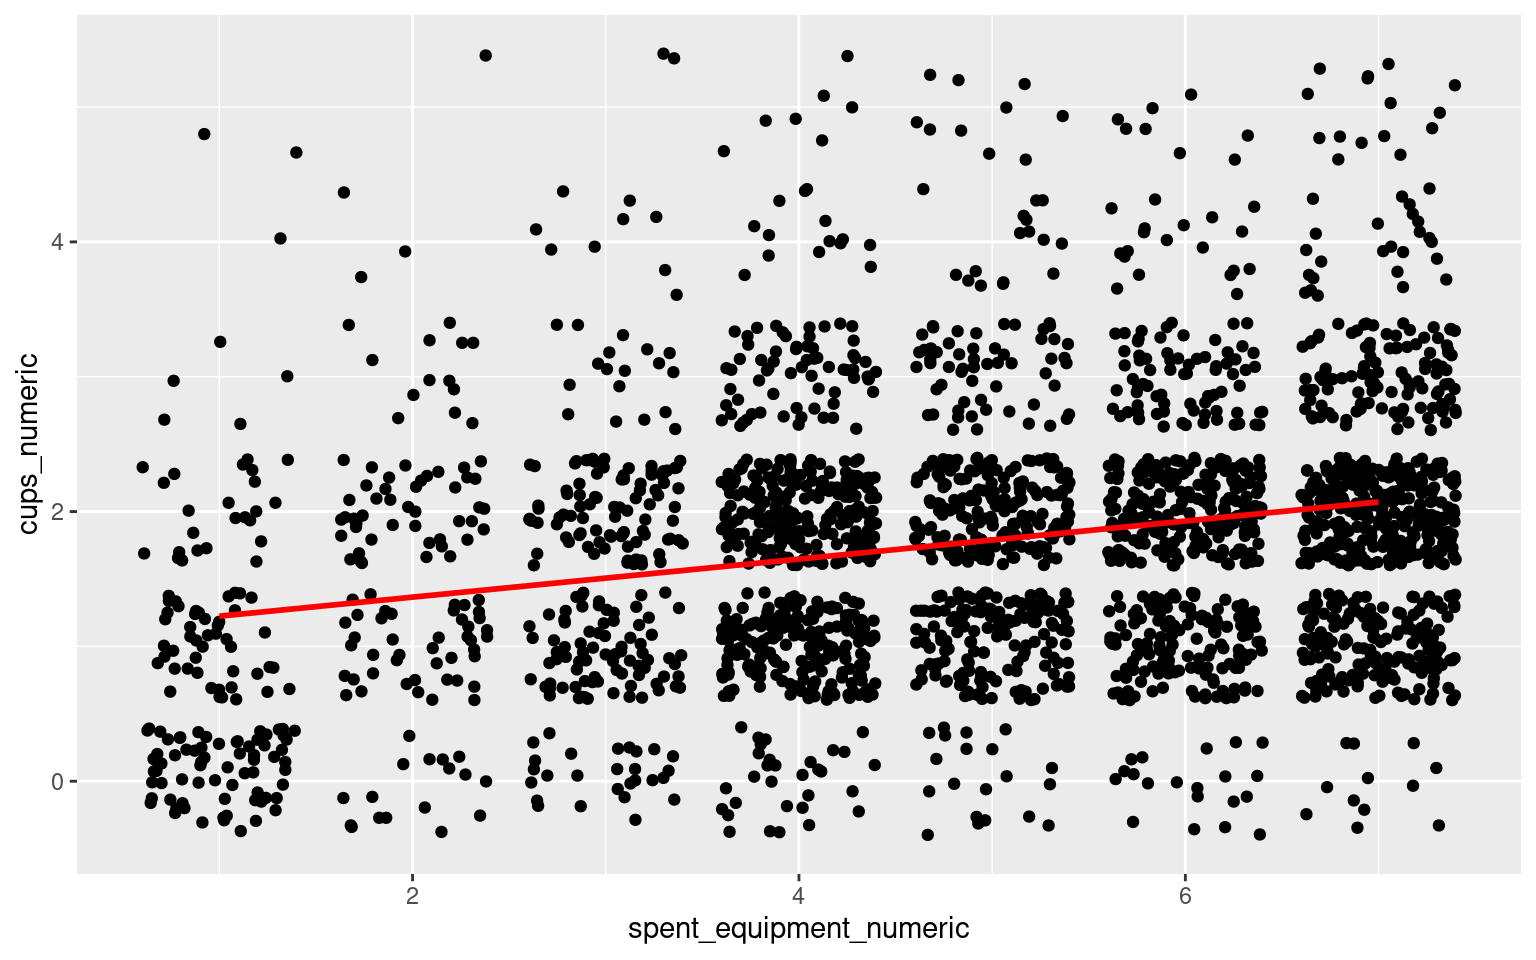
money spent on equipment vs cups of coffee
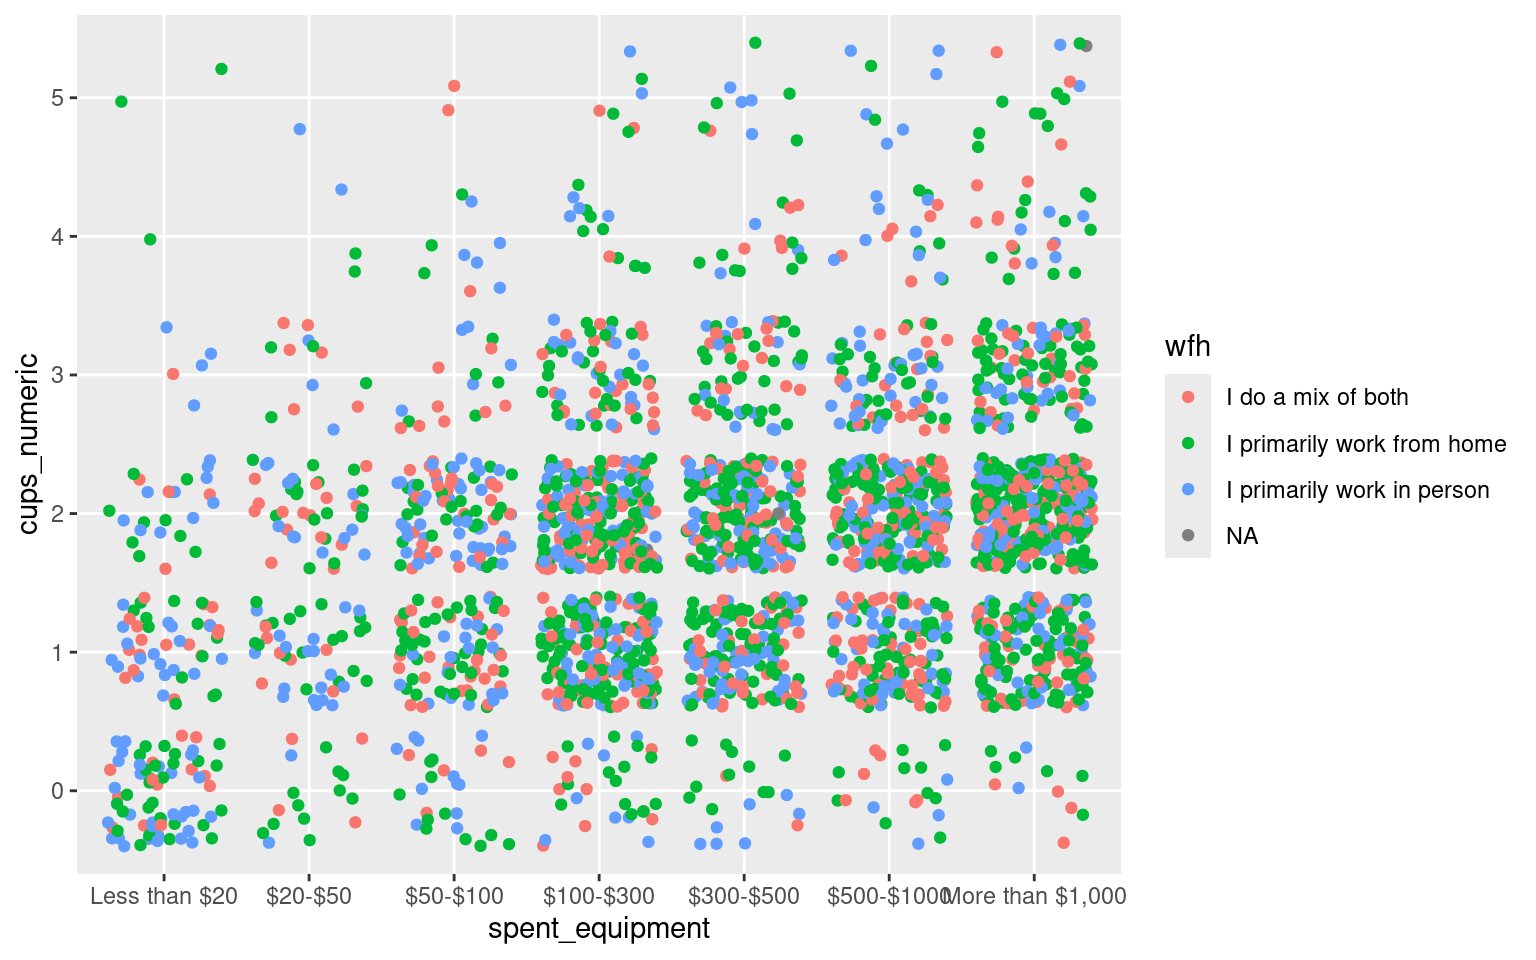
cups vs mode of working
# A tibble: 4 × 2
  wfh                        meancup
  <chr>                        <dbl>
1 I do a mix of both            1.79
2 I primarily work from home    1.77
3 I primarily work in person    1.78
4 <NA>                          3
average cups vs money spent in equipment
# A tibble: 7 × 2
  spent_equipment  meancup1
  <fct>               <dbl>
1 Less than $20       0.822
2 $20-$50             1.54
3 $50-$100            1.60
4 $100-$300           1.74
5 $300-$500           1.84
6 $500-$1000          1.9
7 More than $1,000    2.02
Fit a linear model
Call:
lm(formula = cups_numeric ~ spent_equipment_numeric, data = coffee1)

Residuals:
    Min      1Q  Median      3Q     Max
-2.0711 -0.7888 -0.0711  0.3524  3.7759

Coefficients:
                        Estimate Std. Error t value Pr(>|t|)
(Intercept)              1.08298    0.05560   19.48   <2e-16 ***
spent_equipment_numeric  0.14116    0.01062   13.30   <2e-16 ***
---
Signif. codes:  0 '***' 0.001 '**' 0.01 '*' 0.05 '.' 0.1 ' ' 1

Residual standard error: 0.9574 on 2682 degrees of freedom
Multiple R-squared:  0.06184,   Adjusted R-squared:  0.06149
F-statistic: 176.8 on 1 and 2682 DF,  p-value: < 2.2e-16
Plot for lm